Today's guest blog looks at two beautiful eighteenth century maps of America in our collection. In their own ways, each reflects how the territories of North America were viewed across the vast expanse of water that divided them from Britain. It was written by Emily Casey, a Doctoral Candidate in Art History at the University of Delaware and Short-term Caird Fellow.
How did people in Britain see North America from up close and far away in the eighteenth century? Two maps in the Caird Library at the National Maritime Museum offer differing perspectives to this question.
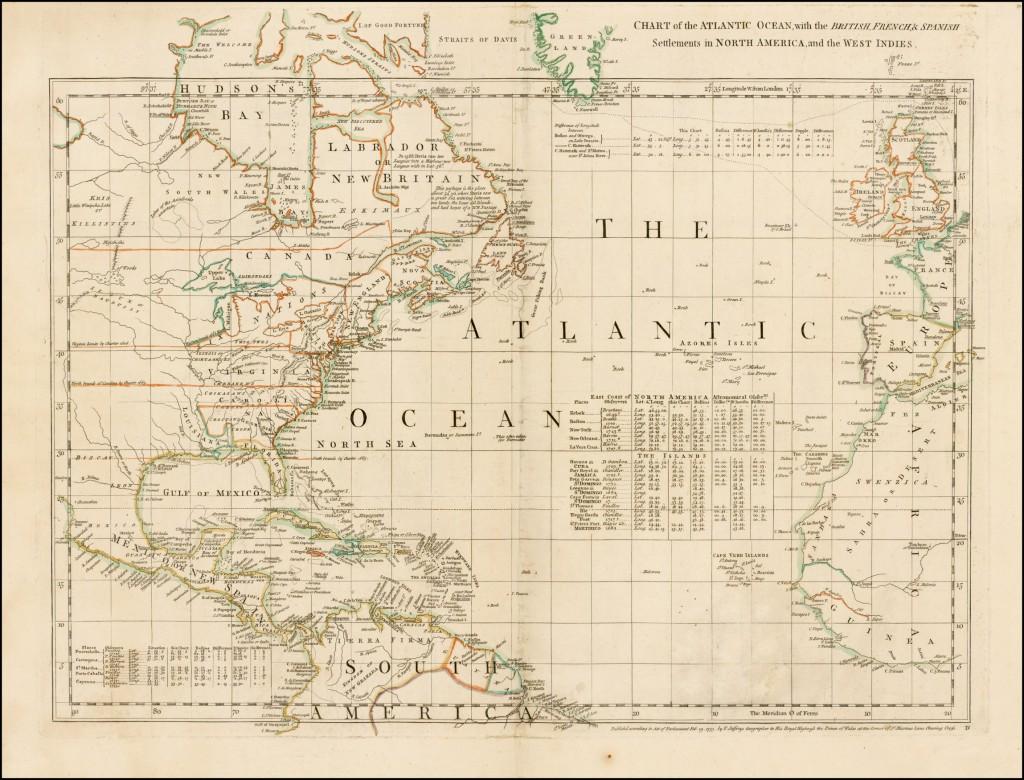
Thomas Jefferys. Chart of the Atlantic Ocean, with the British, French & Spanish settlements in North America and the West Indies (1753) Repro ID: F0194 Object ID: G201:7/1D
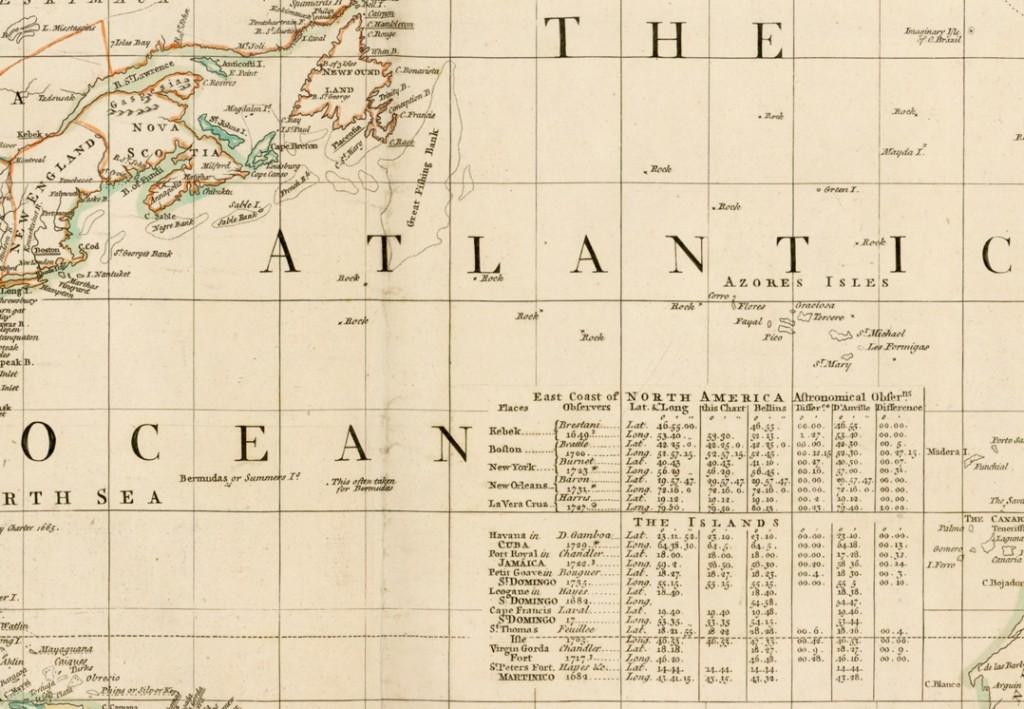
In Thomas Jeffery’s Chart of the Atlantic Ocean, published in 1753, the ocean acts as an accordion, expanding and contracting between Britain and America. Composing the map around the space of the Atlantic pushes landmasses to the margins and emphasizes the ocean’s size, while the gridlines of the Mercator projection measure its distance. The large print words “The Atlantic Ocean” in addition to longitudinal tables, islands, and rocks scattered across the ocean’s surface act as visual stepping stones connecting the space.
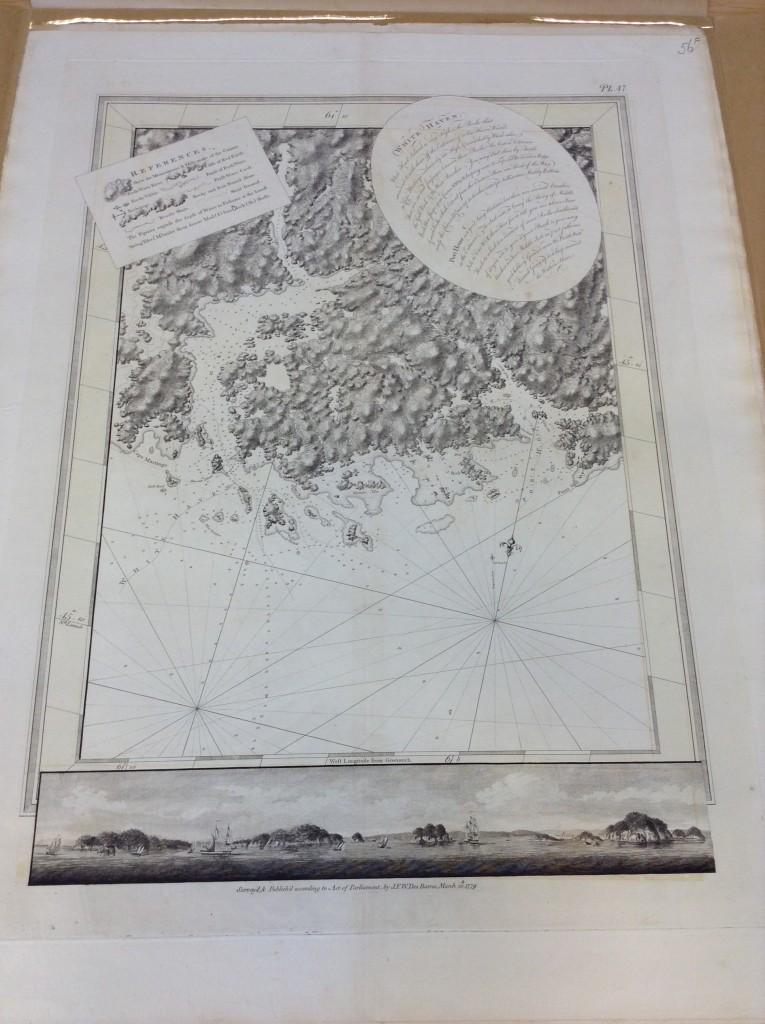
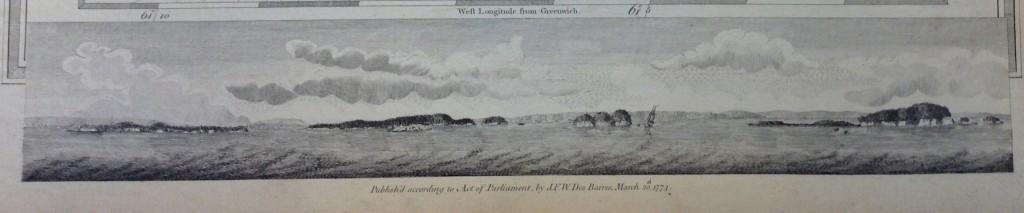
J.F.W. DesBarres’ Chart of White Haven from 1774 takes a different tack. Des Barres published this map of a small portion of Nova Scotia for the British Admiralty as part of a series of surveys of the North American coast which came to be called The Atlantic Neptune. Across the chart appear notations of the water’s depth and dotted lines ending in anchors which show the journey of the ships that surveyed the area. The map maker has meticulously drawn the complex coastlines of the region’s coves, peninsulas, and islands. Engraved lines and smudges of ink create a sense of hilly, rocky terrain, seen from a bird’s eye view. A note at the bottom edge explains that longitude is calculated from Greenwich. Overlapping the upper portion of the map text names and describes the region as well as providing a key to the different symbols used. Beneath the map an engraved view represents the coast as it might appear to a passing ship.
J.F.W. DesBarres. Chart of White Haven (1774) Object ID: HNS52
While Jeffery’s map captured all of the Atlantic and North American coast in a single image, Des Barres focused on a minute portion of the coast with astonishing detail. Even so, the mention of Greenwich at the bottom of the chart virtually connects the distant Nova Scotia coast to Britain. Jefferys used tables of notations which compared and corrected calculations of latitude and longitude from previous mapmakers to allow viewers to more accurately understand the distances across Britain’s Atlantic empire. Des Barres included a seascape and key to provide different ways of visualizing the space he described.
View of the coast from DesBarres' Map. You can also see 'West Longitude from Greenwich' on the map's bottom scale.
Both charts suggest that the colonies and territories of North America were seen through the prism of the ocean waters that divided them from Britain. Contemplating these waters imaginatively drew America near as well as pushed it far away. In a period of imperial expansion and colonial dissolution, this view of the Atlantic reveals how Britons on either side of the ocean struggled to navigate their unity and distance across the waters.
Emily will be one of the speakers at our annual Queen's House conference on Friday (17 July 2015). For more info and to book your place visit the website.